
Statistics
Statistics tells you whether the team is keeping up with its mail. Over the last week, month or quarter, it shows how much came in and went out, how quickly customers got a first answer, what's still waiting for a reply, and who did what.
The page is for Admins and the Owner.
Opening it
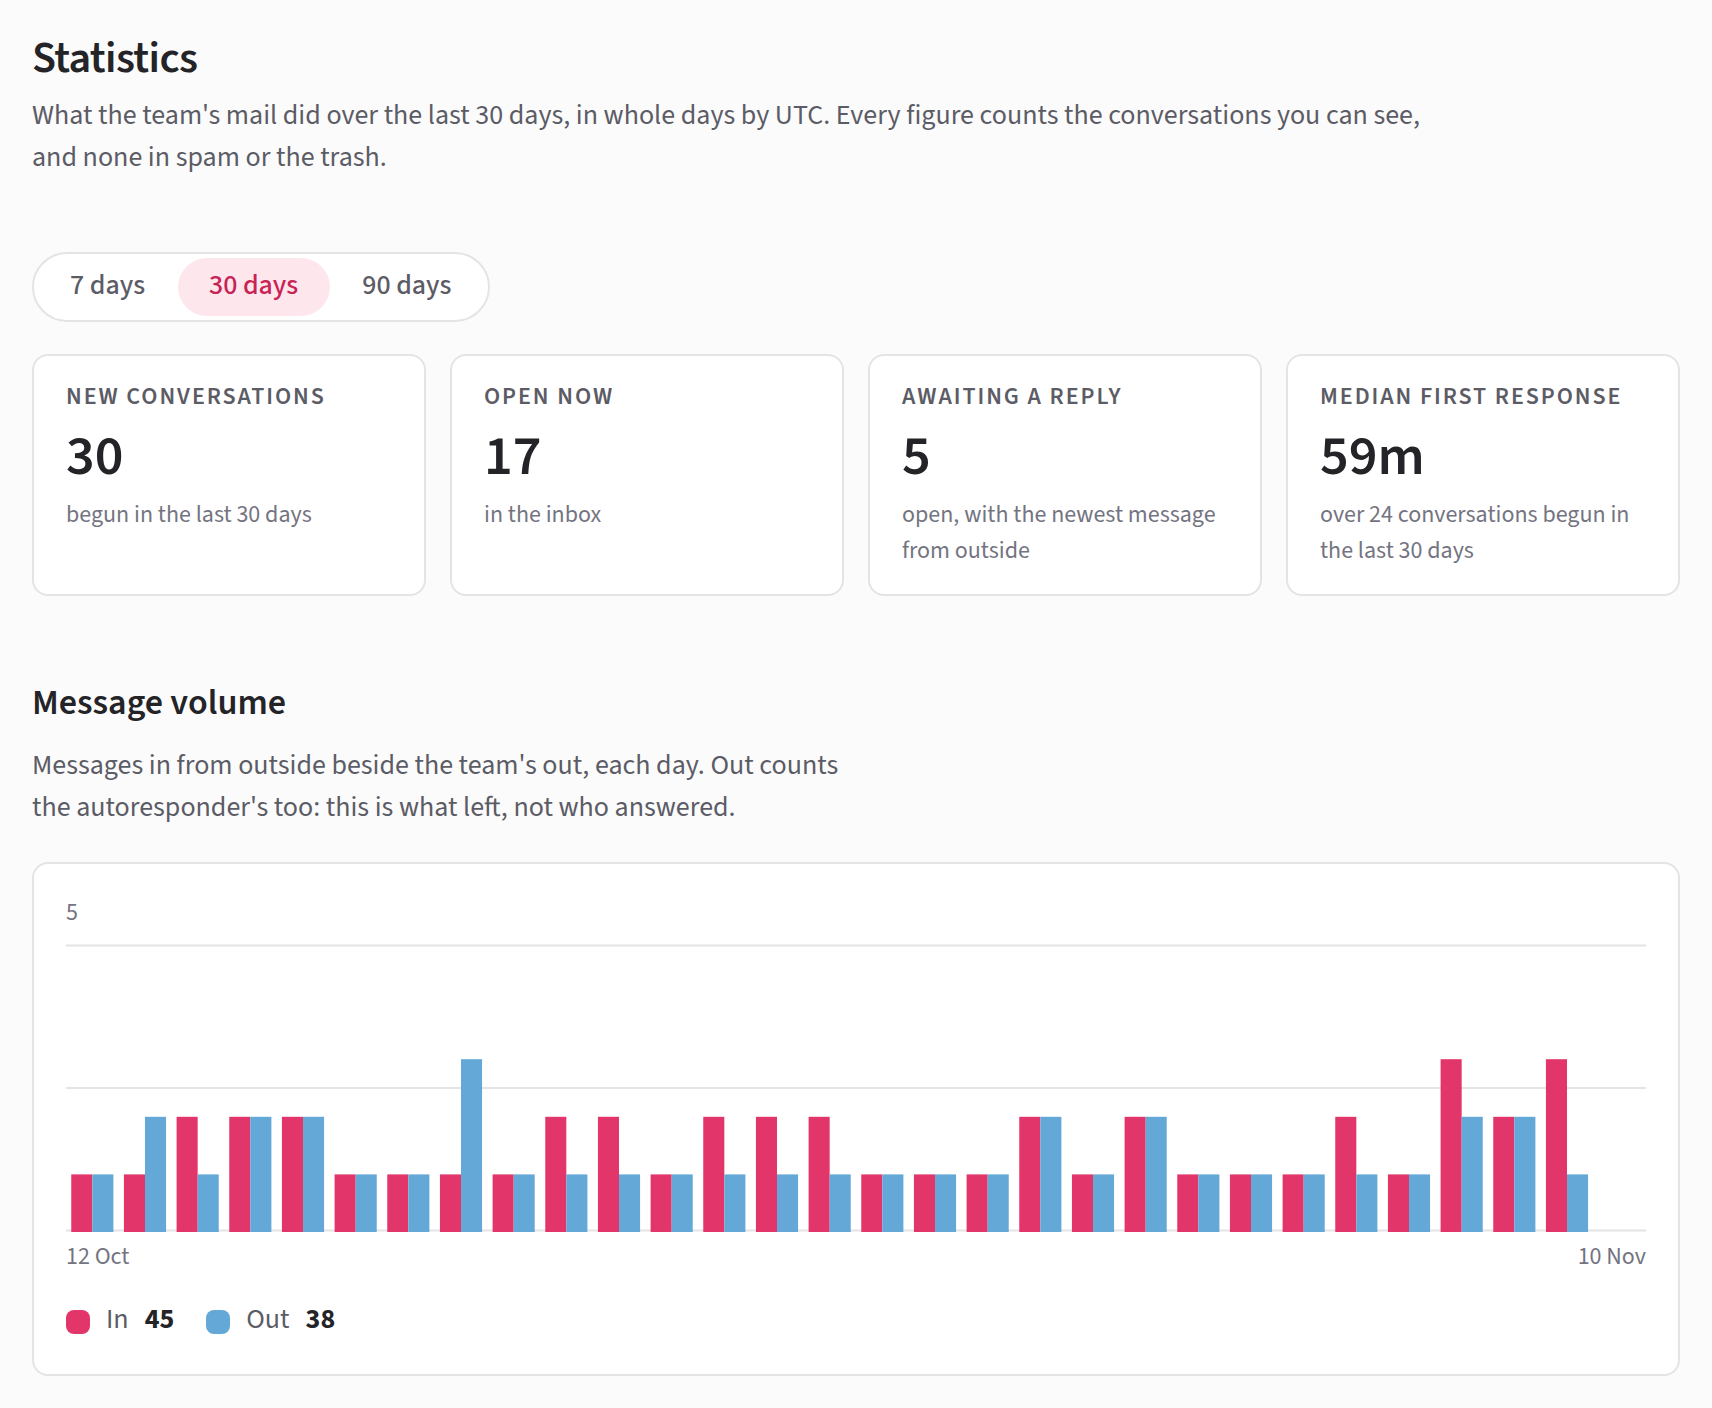
Press Activity in the bar along the top, then choose Statistics in the switch above the page's title. The page opens on the last 30 days. Press 7 days or 90 days to change the period, and point at a day in any chart to read that day's numbers.
The page's address includes the period, so you can bookmark it or send it to a colleague.
What it counts
A few things are true of every figure on the page:
- You see figures for the conversations you can see. If you're not in a mailbox, its mail isn't counted, so two Admins can look at the same period and see different numbers.
- Spam and the trash are left out.
- Days run from midnight to midnight in UTC, which is London's time in winter. If you're far from there, a reply you sent late in the evening may be counted on the next day. The last day is today so far.
The figures at the top
| Figure | What it counts |
|---|---|
| New conversations | Conversations that began in the period, including ones the team started |
| Open now | Conversations in the inbox right now: not snoozed, archived, in spam or in the trash |
| Awaiting a reply | Open conversations whose newest message came from outside the team, right now |
| Median first response | The middle of the times the team took to send a first reply, over conversations that began in the period |
Open now and Awaiting a reply describe this moment, whichever period you choose. Everything else on the page changes with the period.
A first response is the time from a conversation's first incoming message to the team's first reply. The autoresponder's reply doesn't count as one. Conversations nobody has answered yet, and conversations the team started, have no response time, so they're left out of the median. The note under the figure says how many conversations it was taken from.
A customer's out-of-office reply counts as a message from outside, so it can put a conversation in Awaiting a reply.
The charts
Message volume has two bars for each day: messages In from outside, and messages Out from the team, including the autoresponder's.
Response time draws the median first response as a line. Each point is the median over the three days ending there, so one slow day doesn't make a spike. Where the line breaks, no first replies were sent.
Awaiting a reply shows how many open conversations were waiting for a reply at the end of each day. Jelly works this out afterwards from each conversation's history, so treat the past days as a close estimate rather than an exact count.
Needs attention
This is the list to act on: the open conversations waiting for a reply, longest wait first. Click a subject to open the conversation.
A conversation that has waited more than 8 hours is marked Over 8 hours, and one that has waited more than 24 is marked Over a day. The wait is counted from the customer's newest message, so if they write again, the clock starts again.
The list shows the 25 longest waits and says how many more there are.
Team activity
Everyone on the team is listed here, busiest first, with what they did in the period:
- replies sent: every message they sent, including new conversations they started;
- notes: the notes they wrote;
- archived: how many times they archived a conversation. Archiving done by a rule isn't counted.
Somebody who is away has a label saying so, which often explains a quiet row.
Conversation depth
This shows how long the period's conversations have run so far: how many have 1 message, 2–3 messages, 4–6 messages, 7–10 messages or More than 10, with the average underneath. Every message counts, the autoresponder's included. Notes don't.
Other periods
The buttons offer 7, 30 and 90 days, but you can ask for any number of
days from 7 to 90 by changing the number at the end of the page's
address, such as ?period=14.
The same figures elsewhere
Everything on this page is also in the
API, and an AI
assistant can read it with get_statistics.
Anyone on the team can read statistics that way, not only Admins. As on this page, the figures cover only the mailboxes that person can see, so a Member's numbers may not be the whole team's.